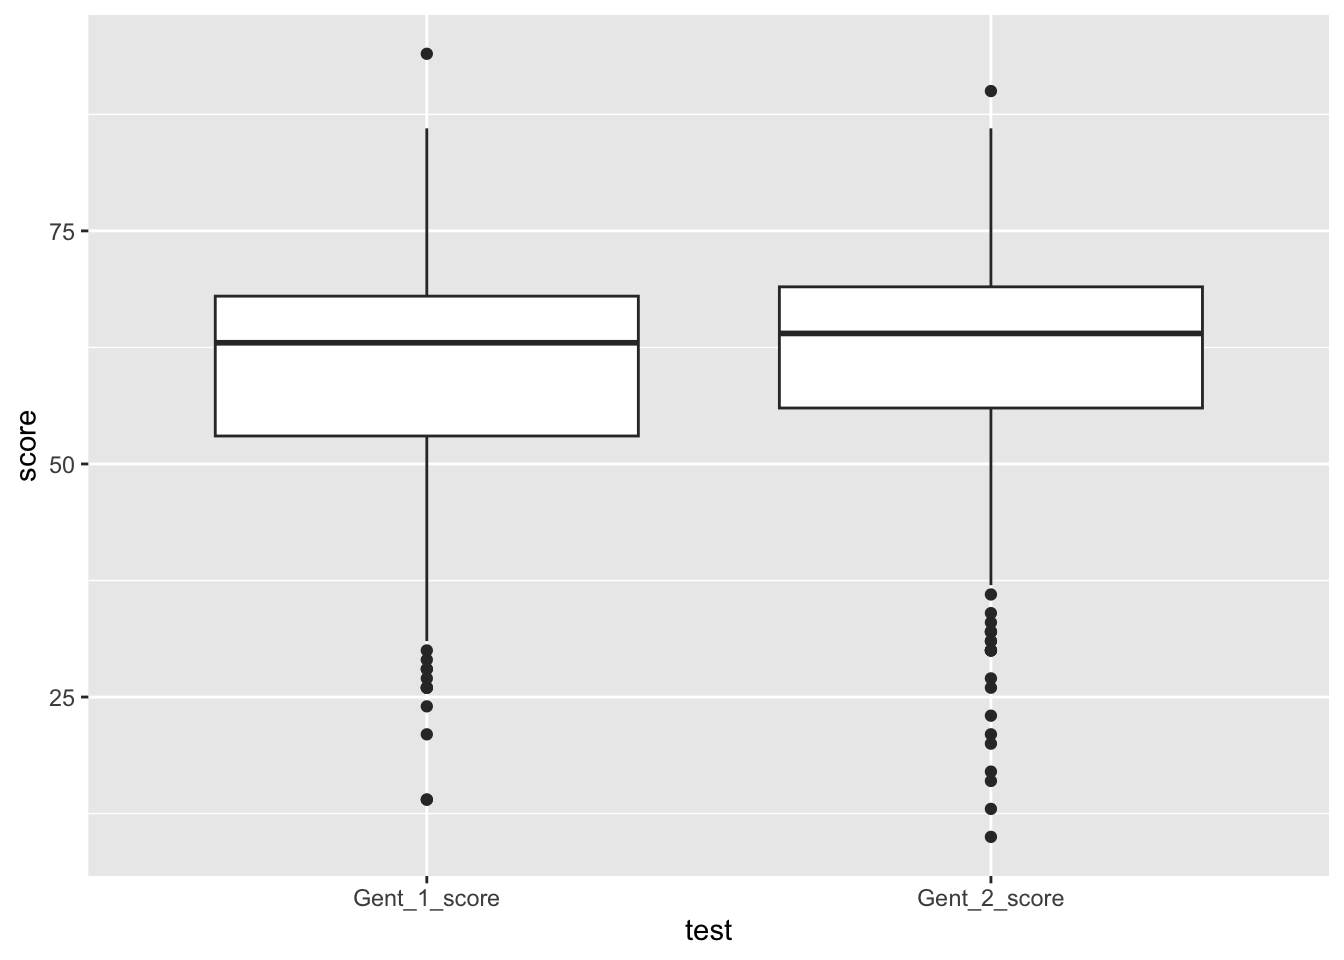
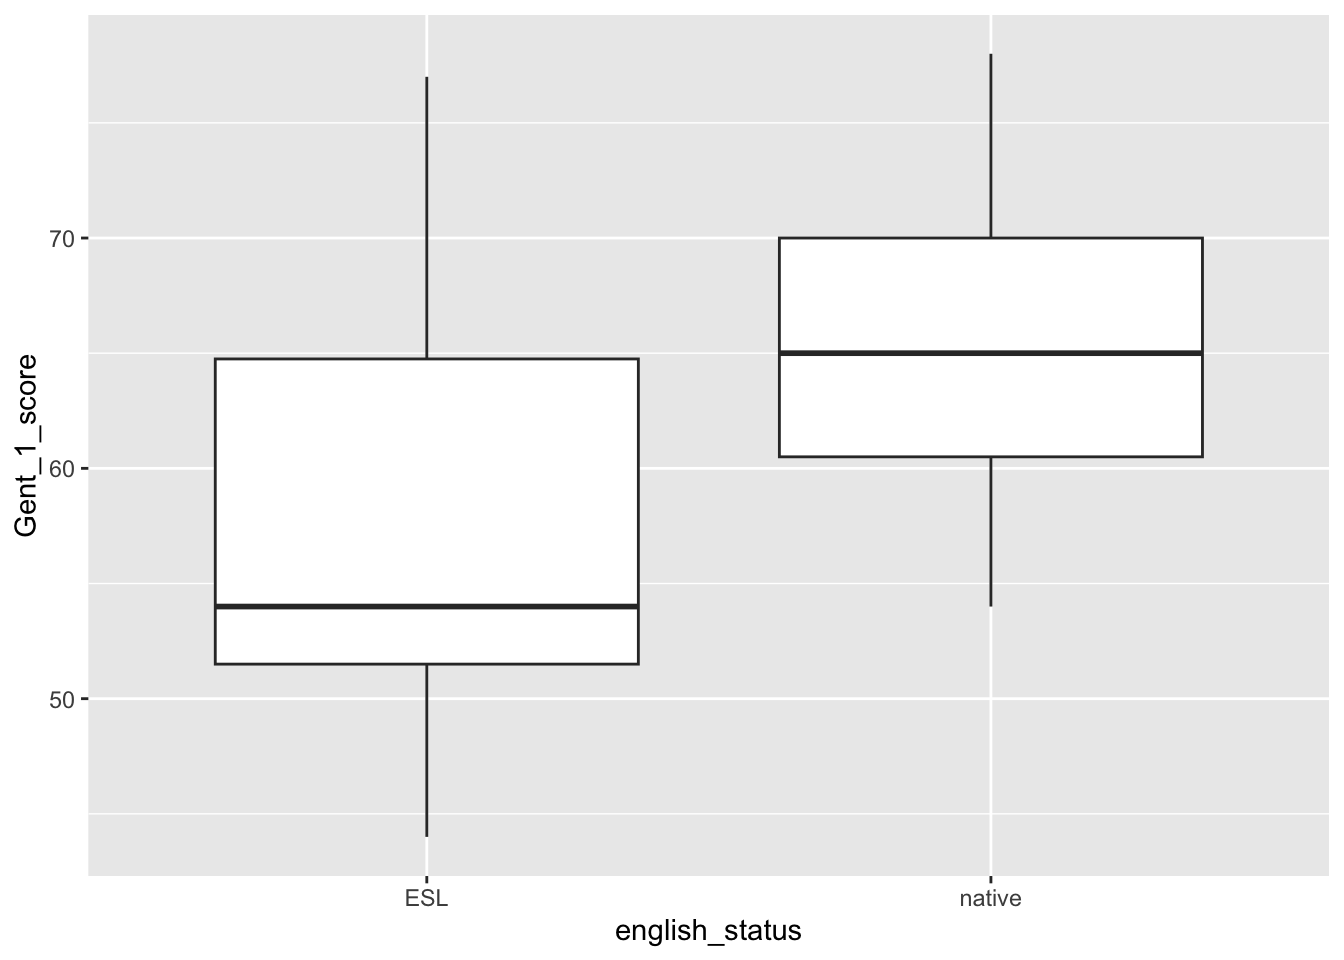
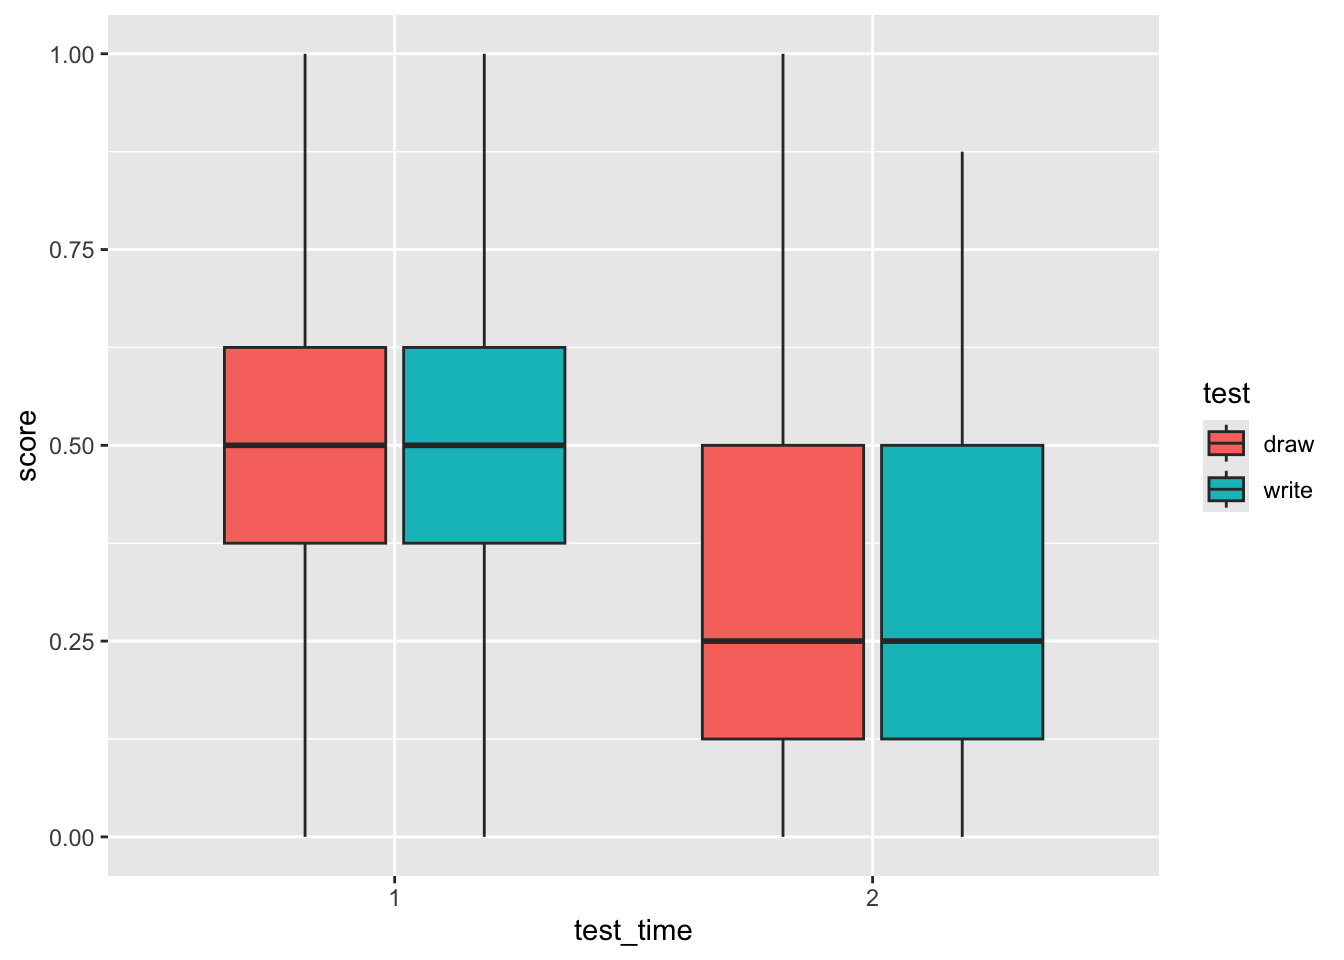
rm(list=ls())
library(tidyverse)
── Attaching core tidyverse packages ──────────────────────── tidyverse 2.0.0 ──
✔ dplyr 1.2.1 ✔ readr 2.2.0
✔ forcats 1.0.1 ✔ stringr 1.6.0
✔ ggplot2 4.0.3 ✔ tibble 3.3.1
✔ lubridate 1.9.5 ✔ tidyr 1.3.2
✔ purrr 1.2.2
── Conflicts ────────────────────────────────────────── tidyverse_conflicts() ──
✖ dplyr::filter() masks stats::filter()
✖ dplyr::lag() masks stats::lag()
ℹ Use the conflicted package (<http://conflicted.r-lib.org/>) to force all conflicts to become errors# from week4 practical
dat <- read_csv("data/wk4/PSYC7142-shipley-scores-anonymous-17_26_year_language.csv") Rows: 325 Columns: 7
── Column specification ────────────────────────────────────────────────────────
Delimiter: ","
chr (1): english_status
dbl (6): subject_ID, Age, Shipley_Voc_Score, Gent_1_score, Gent_2_score, aca...
ℹ Use `spec()` to retrieve the full column specification for this data.
ℹ Specify the column types or set `show_col_types = FALSE` to quiet this message.dat$academic_year <- as.factor(dat$academic_year)
#View(dat)
# from week2 practical
dat2 <- read_csv("data/wk2/ahicesd.csv")Rows: 992 Columns: 50
── Column specification ────────────────────────────────────────────────────────
Delimiter: ","
dbl (50): id, occasion, elapsed.days, intervention, ahi01, ahi02, ahi03, ahi...
ℹ Use `spec()` to retrieve the full column specification for this data.
ℹ Specify the column types or set `show_col_types = FALSE` to quiet this message.pinfo <- read_csv("data/wk2/participantinfo.csv")Rows: 295 Columns: 6
── Column specification ────────────────────────────────────────────────────────
Delimiter: ","
dbl (6): id, intervention, sex, age, educ, income
ℹ Use `spec()` to retrieve the full column specification for this data.
ℹ Specify the column types or set `show_col_types = FALSE` to quiet this message.all_dat <- inner_join(x = dat2, y = pinfo, by = c("id", "intervention"))
summarydata <- select(all_dat, id, ahiTotal, cesdTotal, age, occasion)
dat_17 <- filter(dat, academic_year == "201718")
all_dat2 <- group_by(all_dat, intervention, occasion)
summarise(all_dat2, mean(ahiTotal), sd(ahiTotal), n())`summarise()` has regrouped the output.
ℹ Summaries were computed grouped by intervention and occasion.
ℹ Output is grouped by intervention.
ℹ Use `summarise(.groups = "drop_last")` to silence this message.
ℹ Use `summarise(.by = c(intervention, occasion))` for per-operation grouping
(`?dplyr::dplyr_by`) instead.# A tibble: 24 × 5
# Groups: intervention [4]
intervention occasion `mean(ahiTotal)` `sd(ahiTotal)` `n()`
<dbl> <dbl> <dbl> <dbl> <int>
1 1 0 68.4 14.0 72
2 1 1 69.5 13.4 30
3 1 2 70.3 15.7 38
4 1 3 75.0 12.8 29
5 1 4 76.5 16.2 36
6 1 5 75.5 14.5 27
7 2 0 68.8 13.0 76
8 2 1 71.6 12.5 48
9 2 2 73.0 14.0 48
10 2 3 72.5 14.2 43
# ℹ 14 more rowsggplot(dat, aes(x = Age)) + geom_histogram()`stat_bin()` using `bins = 30`. Pick better value `binwidth`.Warning: Removed 248 rows containing non-finite outside the scale range
(`stat_bin()`).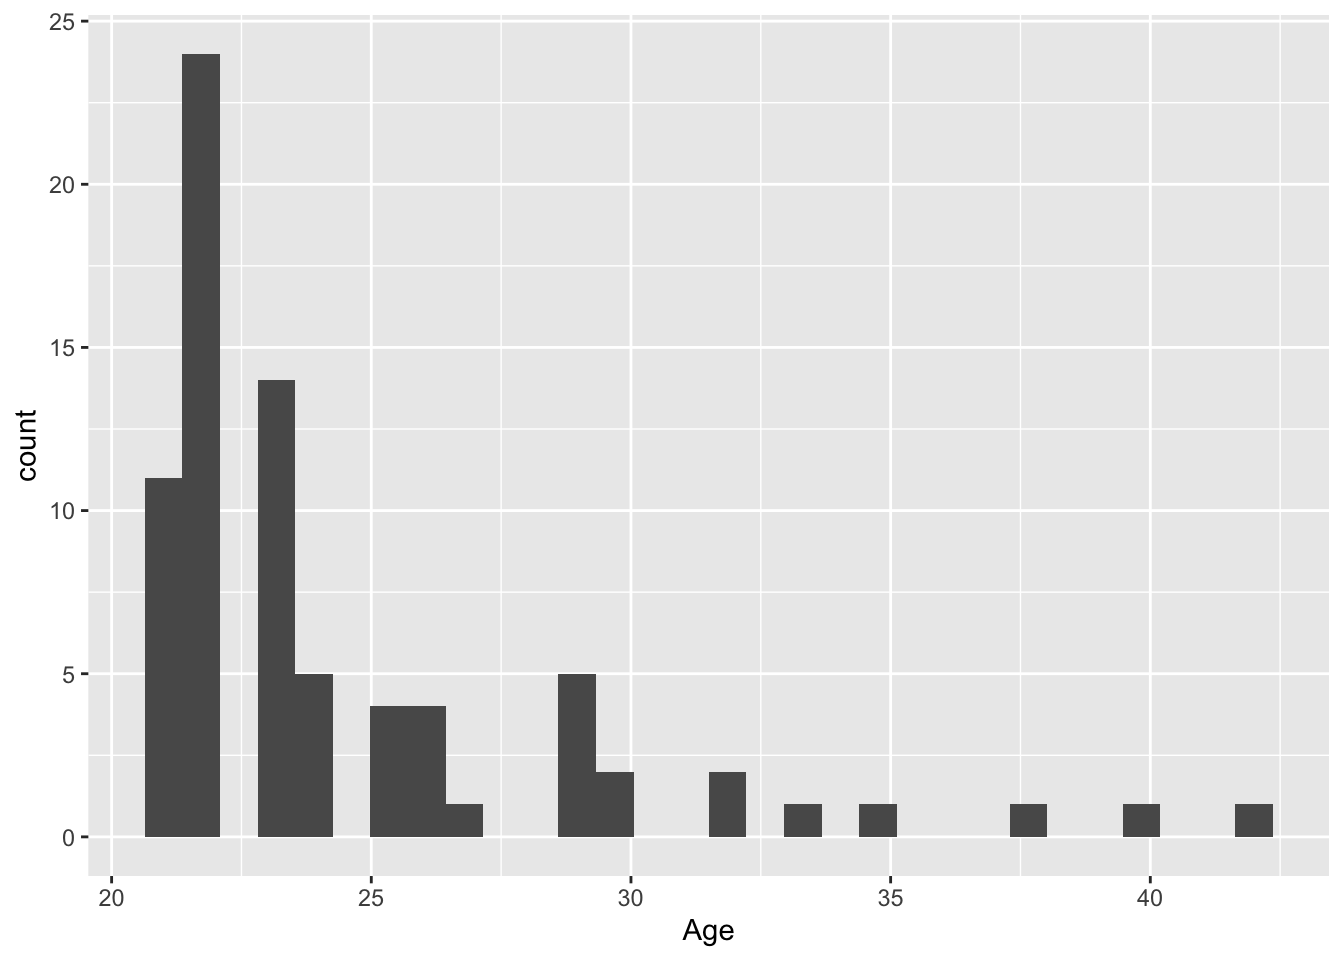
ggplot(dat, aes(x = Shipley_Voc_Score, y = Gent_1_score)) + geom_point()Warning: Removed 11 rows containing missing values or values outside the scale range
(`geom_point()`).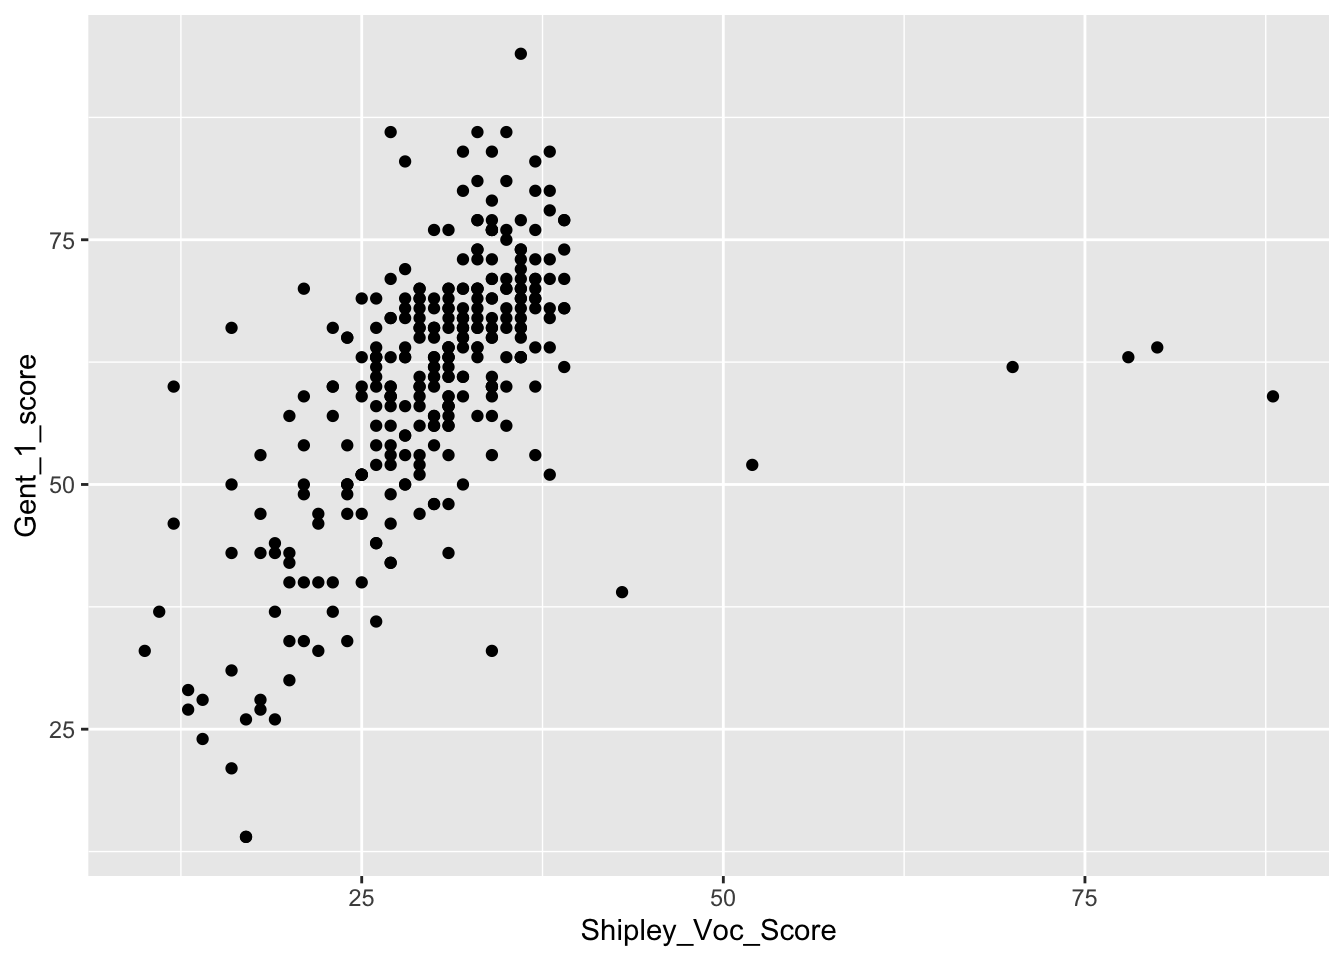
ggplot(dat, aes(x = Shipley_Voc_Score, y = Gent_1_score)) + geom_point() + geom_smooth( method = lm)`geom_smooth()` using formula = 'y ~ x'Warning: Removed 11 rows containing non-finite outside the scale range
(`stat_smooth()`).Warning: Removed 11 rows containing missing values or values outside the scale range
(`geom_point()`).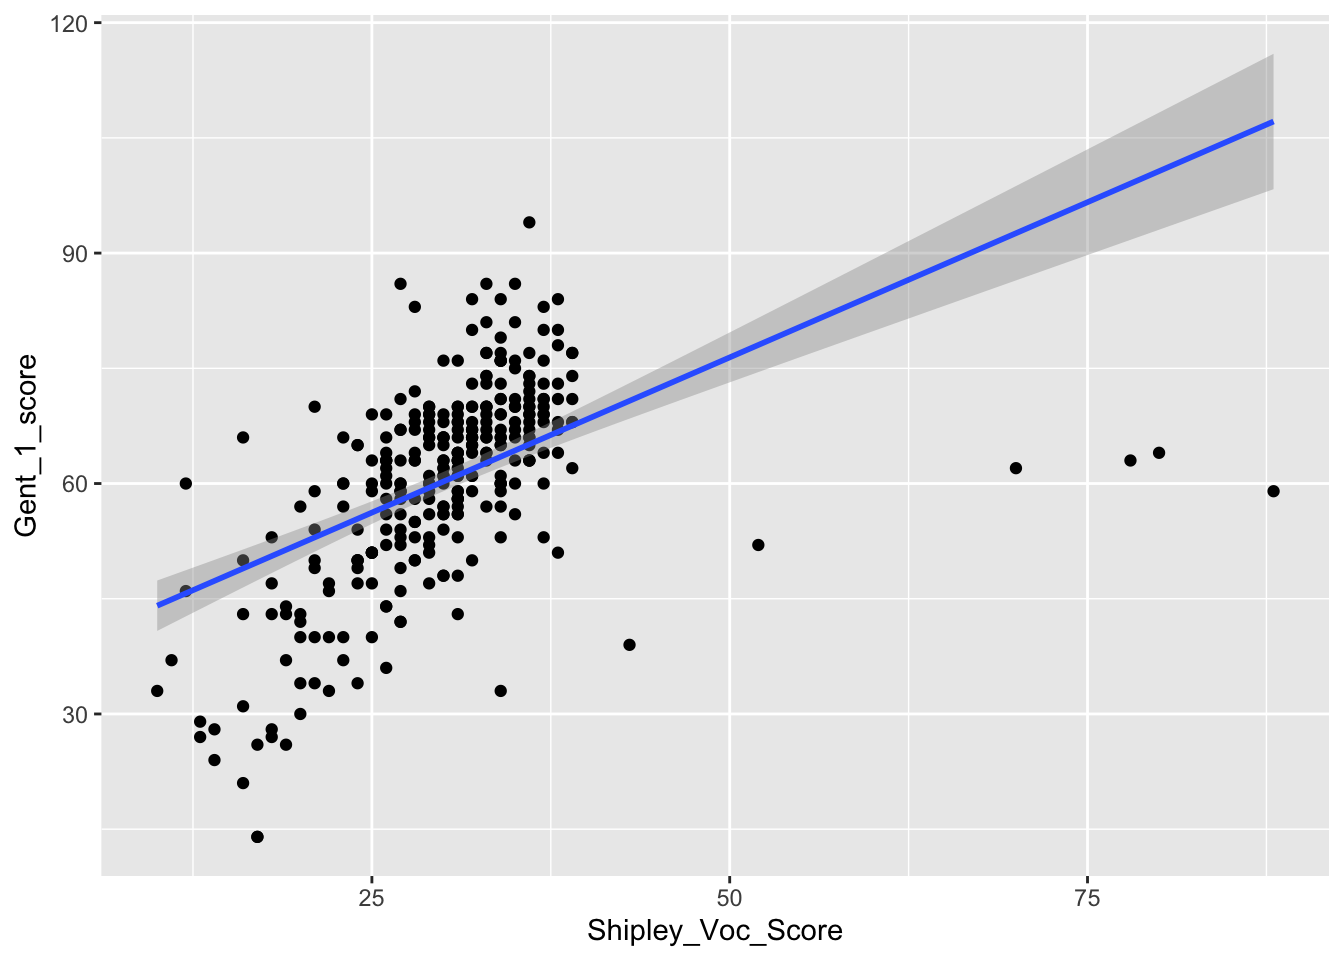
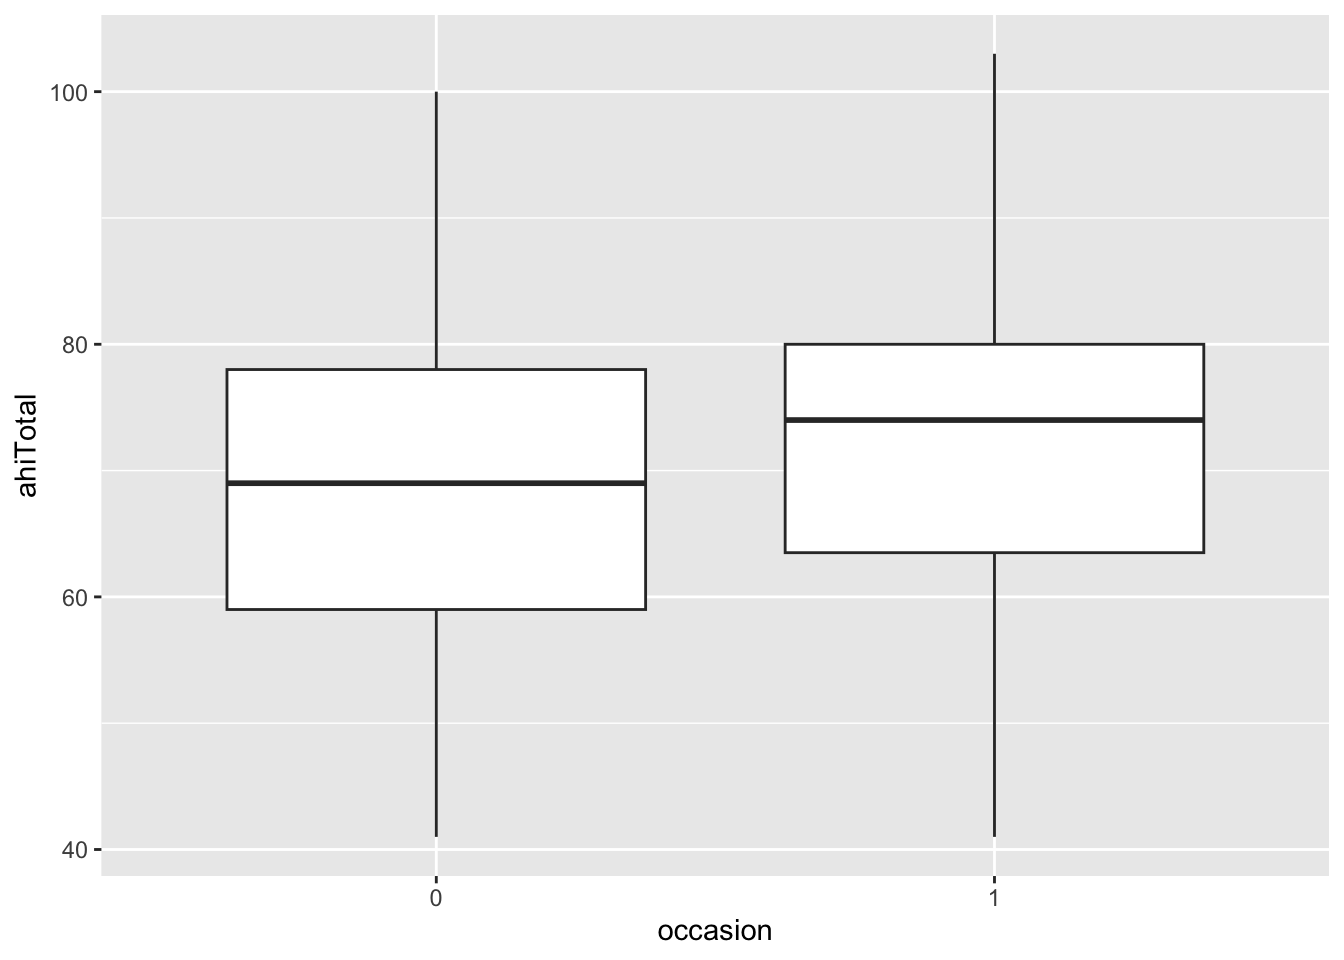
all_dat$occasion <- as.factor(all_dat$occasion)
ggplot(all_dat, aes(x = occasion, y = ahiTotal)) + geom_boxplot()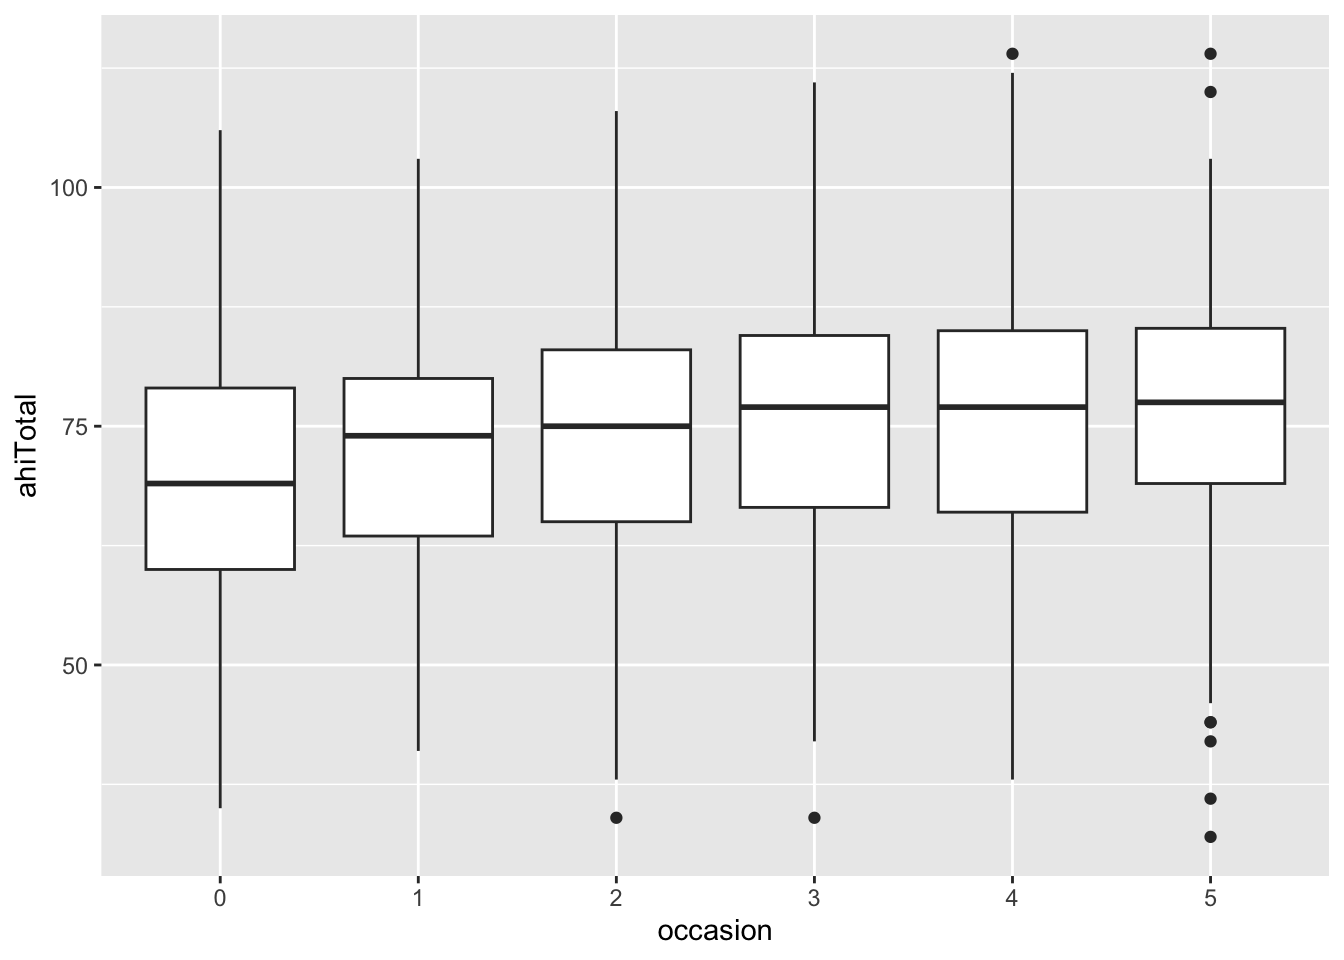
dat_long <- pivot_longer(dat, names_to = "test", values_to = "score", cols = c("Gent_1_score", "Gent_2_score"))
# or:
dat_long <- pivot_longer(dat, names_to = "test", values_to = "score", cols = starts_with("Gent"))
dat_wide <- pivot_wider(dat_long, names_from = "test", values_from = "score")

library(lsr)
chisq.test(x = all_dat$occasion, y = all_dat$intervention)
    Pearson's Chi-squared test

data:  all_dat$occasion and all_dat$intervention
X-squared = 9.7806, df = 15, p-value = 0.8333cramersV(x = all_dat$occasion, y = all_dat$intervention)[1] 0.05732779